Media and Leftists conclusion: Trump created an affordability crisis

The figures I provided are not projections, speculation, or reinterpretations. They are literal excerpts from the U.S. Treasury’s “Historical Debt Outstanding” dataset and the Committee for a Responsible Federal Budget’s published analyses. You are free to disagree with my conclusions, but the numerical statements themselves are not in dispute.

The Treasury numbers you quoted back at me are exactly the ones I used.
Debt at end of FY 2021: ~28.45T
FY 2022: ~30.93T
FY 2023: ~33.17T
FY 2024: ~35.46T
Source: U.S. Treasury, FiscalData.
These are not “speculations” or “excuses”; they are the official totals. They show a ~7T rise during Biden’s term because that is what the Treasury dataset records.

The deficit figure (~1.8T for FY 2024) comes directly from CRFB.
CRFB is a non-partisan budget watchdog. Their conclusion that FY 2024 was one of the largest non-pandemic deficits is their wording, not mine. Again, this is a reported number, not an interpretation.

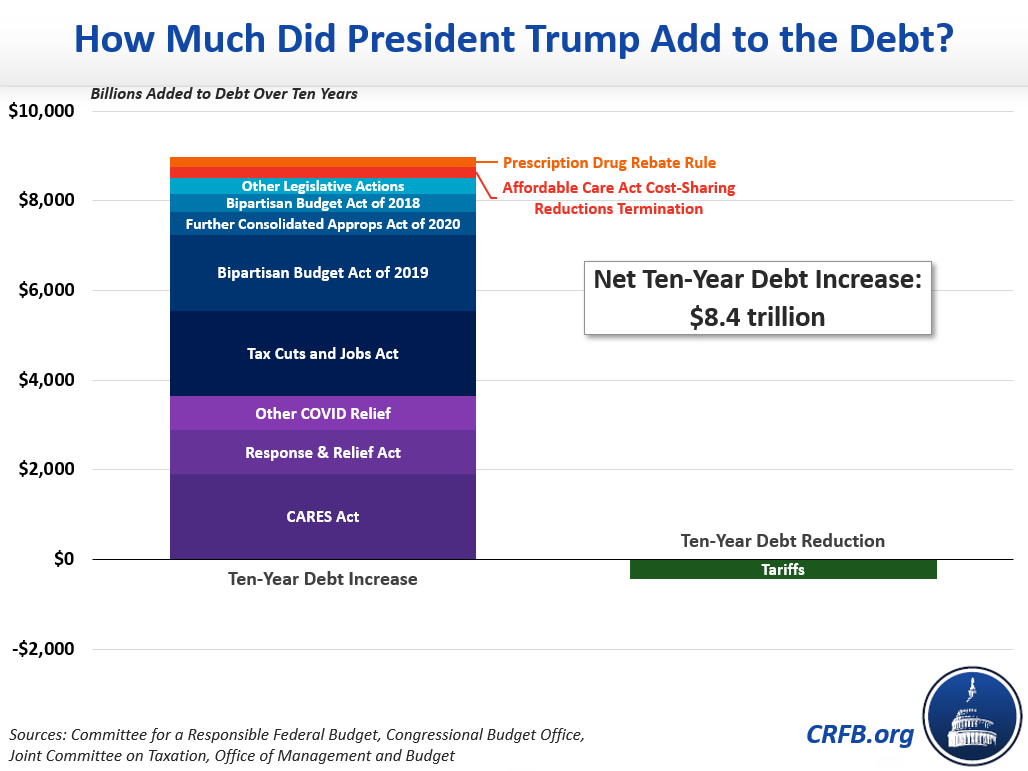
The 8.4T (Trump) and 4.3T (Biden) ten-year borrowing numbers are taken directly from CRFB’s comparison report.
CRFB provides both “total” and “excluding COVID relief” numbers for each president. I quoted both to avoid selective framing. These are not inventions; they are the published figures in the report I linked.

Saying that debt rose sharply during Biden’s term is simply a description of the dataset.
I did not say he “caused” all of it. I said the debt rose from ~28.45T to ~35.46T while he was in office. That is a factual, time-stamped observation. Whether one attributes that rise to inherited conditions, legislative choices, economic cycles, or global events is a separate debate.

Your claim that I am ignoring COVID relief under Trump is incorrect.
In the very same outline you are criticizing, I cited CRFB’s distinction between:
– Trump total borrowing: ~8.4T
– Trump excluding COVID: ~4.8T
– Biden total borrowing: ~4.3T
– Biden excluding COVID: ~2.2T
If anything, I went out of my way to avoid the simplistic narrative you are accusing me of using.

The dispute here is not about the numbers. The numbers come directly from the Treasury and CRFB. The disagreement is about interpretation, but you cannot dismiss the figures themselves as “dishonest” when they are reproduced exactly from the sources provided. If you want to argue causes or responsibility, that is a different conversation — but the empirical record is not in question.

My position is straightforward and fully supported by the public record. I cited the debt levels recorded by the U.S. Treasury at the start and end of Biden’s term and at the start of Trump’s current term and late 2025. I also cited CRFB’s published figures on new ten-year borrowing approved under each president. These are not projections or interpretations; they are time-stamped facts from the sources provided. My statements describe what the debt was during each presidency, not who personally “caused” each increase, which is a separate analytical question involving Congress, inherited obligations, interest, and economic conditions.

The pushback you are making assumes I was assigning full causal responsibility to one president or absolving another. I made no such claim. You are reading a narrative into the numbers that I did not assert. The data show only the debt levels over time and the borrowing approved in specific legislative periods. Any further interpretation is coming from your assumptions, not from what I actually wrote.

Wow, that's a lot of (dis) information.

Let's start with what is true and semi-true.

The national debt on Jan. 19, 2017, the day before Donald Trump was inaugurated president, was $19,944,429,217,107.

On Jan. 19, 2021, the day before Joe Biden was inaugurated, the debt was: $27,752,835,868,445 — about $7.8 trillion higher.

You pumped it up to $8.4 - just a bit of padding.

$4 trillion was on relief for the Wuhan Designer Virus®. Leaving about $3.8 trillion. Of that, nearly $2.4 trillion was accrued debt across 10 years due to the middle class tax breaks passed by congress in 2018. Accrued debt not due to spending, but the reduction in expected revenue over 10 years due to the reduction in the tax burden carried by working families.

Likewise some pretty serious game are played with the Biden debt. Whereas debt that accrues across 10 years due to the middle class tax cuts is directly attributed to Trump, such accrual is not employed with Biden and the "Green Raw Deal" or so-called "deficit reduction act." The Green Raw Deal in fact caused the Non-Covid Biden debt to be $6.1 Trillion.


Again, the delta between what the DNC press corps reports and the actual number is due to accruing future revenue reduction due to tax cuts to Trump, but NOT accruing the debt from the Green Raw Deal to Biden.

So why the disparity in reporting? Because the OMB is a highly partisan group that is not obligated to follow GAAP. What is particularly infuriating is the realization that the Green Raw Deal is basically an embezzlement scheme to transfer trillions in taxpayer money to the well connected billionaires of the democrat party.
I want to clarify this cleanly because the numbers I used were not padded, invented, or taken from partisan outlets. They came directly from the U.S. Treasury’s Historical Debt Outstanding dataset and from the Committee for a Responsible Federal Budget, which applies the same scoring method to every administration going back decades. The $8.4 trillion figure for Trump is CRFB’s official estimate of his approved ten-year borrowing. That is the standard method used by CBO, JCT, and CRFB for all presidents, and it includes the 2017 tax cuts, routine spending, and the emergency COVID packages. You cited the raw debt increase from 2017 to 2021, which is correct at about $7.8 trillion, but that is a different measurement. Treasury numbers show the raw rise in debt during the term; CRFB numbers show the ten-year effect of laws that were enacted. Those two figures will never be identical because they measure different things. The ten-year score is not a partisan trick—it is how federal budget law requires tax and spending effects to be calculated, for every administration without exception.

Your point about the tax cuts is correct in one respect: about $2.4 trillion of Trump’s long-term borrowing came from the 2017 tax law’s revenue effects. But again, that is not selective scoring. All tax legislation is scored over ten years by statute. That rule did not start with Trump and does not change under Biden. Likewise, the Inflation Reduction Act was scored over a full ten-year window by CBO, JCT, and CRFB, and all three found that it modestly reduced deficits once offsets were included. You may dislike the law, but the claim that it was not scored or was hidden is simply not supported by the official record. The $6.1 trillion figure you quoted for Biden’s “non-COVID debt” does not come from CBO, JCT, CRFB, Moody’s, or any other recognized fiscal authority. It comes from political commentary, not from the bodies responsible for legally mandated scorekeeping. If CRFB had documented a $6.1 trillion long-term burden from Biden’s policies, they would have published it—they did not. Instead, they published a $4.7 trillion figure using the same method they used to score Trump at $8.4 trillion.

The idea that the “DNC press corps,” OMB, or any other partisan actor is hiding the numbers doesn’t fit the facts. The values I cited came from the Treasury for raw debt totals and from CRFB for long-term borrowing. Treasury reports are non-political by definition, and CRFB is widely recognized as one of the most consistent independent fiscal monitors in Washington. None of the numbers I used came from OMB, and none depended on any partisan interpretation. I quoted the debt at the start and end of each term, and I quoted CRFB’s long-term borrowing totals for both presidents. Those figures are public, time-stamped, and applied with identical methodology across administrations.

I’ve said from the start that the dispute here is not about the data; the data are straightforward and publicly verifiable. The disagreement is about the narrative being inferred from the data. I did not claim Trump personally caused every dollar of his increase, and I did not claim Biden personally caused every dollar of his. I stated what the debt levels were during their terms and what the scoring bodies recorded as the long-term effects of the legislation each signed. The empirical record is consistent; the interpretation you are reading into it is not something I wrote.

Maybe this will help:

U.S. Treasury – Official Debt Totals

Historical Debt Outstanding (raw Treasury numbers):

U.S. Treasury – Official Deficit Totals

Monthly Treasury Statement – Deficit data:

CRFB – Trump vs. Biden Debt Comparison (long-term borrowing)

Trump and Biden National Debt comparison:

CRFB – Trump Total Borrowing Analysis

How Much Did President Trump Add to the Debt?

CRFB – Biden Total Borrowing Analysis

How Much Has President Biden Added to the Debt?

CBO – Score of Biden’s Inflation Reduction Act (IRA)

CBO Cost Estimate for H.R. 5376 (Inflation Reduction Act):

JCT – Score of Trump’s 2017 Tax Cuts (TCJA)

Joint Committee on Taxation revenue estimate for Public Law 115-97:

Optional Neutral Confirmation Sources (broader fiscal context)

CBO – Long-Term Budget Outlook
This shows major drivers of federal deficits long-term (healthcare, interest, aging, etc.):

GAO – Fiscal Exposures Report
Government Accountability Office’s official review of structural long-term fiscal pressures:
 
MAGAT morons seem to have a lot of difficulty understanding economics, esp. things like oil being a global commodity sold on the global market. It doesn't matter how often that is explained to them; they simply refuse to believe it.

If the #CorruptCarrot has the power to control oil prices, why isn't gasoline cheaper? It's been up and down here, but generally the same as it's been for the last couple of years.
He panders to the idiots who still believe 'drill baby drill' is going to lower prices. We are at max production for quite some time now...with a slight easing due to Covid.

The Yam's claim that he's opening up Alaska to drilling is meaningless. There will be no drilling in Alaska anytime soon.
 
I want to clarify this cleanly because the numbers I used were not padded, invented, or taken from partisan outlets. They came directly from the U.S. Treasury’s Historical Debt Outstanding dataset and from the Committee for a Responsible Federal Budget, which applies the same scoring method to every administration going back decades. The $8.4 trillion figure for Trump is CRFB’s official estimate of his approved ten-year borrowing. That is the standard method used by CBO, JCT, and CRFB for all presidents, and it includes the 2017 tax cuts, routine spending, and the emergency COVID packages. You cited the raw debt increase from 2017 to 2021, which is correct at about $7.8 trillion, but that is a different measurement. Treasury numbers show the raw rise in debt during the term; CRFB numbers show the ten-year effect of laws that were enacted. Those two figures will never be identical because they measure different things. The ten-year score is not a partisan trick—it is how federal budget law requires tax and spending effects to be calculated, for every administration without exception.

Your point about the tax cuts is correct in one respect: about $2.4 trillion of Trump’s long-term borrowing came from the 2017 tax law’s revenue effects. But again, that is not selective scoring. All tax legislation is scored over ten years by statute. That rule did not start with Trump and does not change under Biden. Likewise, the Inflation Reduction Act was scored over a full ten-year window by CBO, JCT, and CRFB, and all three found that it modestly reduced deficits once offsets were included. You may dislike the law, but the claim that it was not scored or was hidden is simply not supported by the official record. The $6.1 trillion figure you quoted for Biden’s “non-COVID debt” does not come from CBO, JCT, CRFB, Moody’s, or any other recognized fiscal authority. It comes from political commentary, not from the bodies responsible for legally mandated scorekeeping. If CRFB had documented a $6.1 trillion long-term burden from Biden’s policies, they would have published it—they did not. Instead, they published a $4.7 trillion figure using the same method they used to score Trump at $8.4 trillion.

The idea that the “DNC press corps,” OMB, or any other partisan actor is hiding the numbers doesn’t fit the facts. The values I cited came from the Treasury for raw debt totals and from CRFB for long-term borrowing. Treasury reports are non-political by definition, and CRFB is widely recognized as one of the most consistent independent fiscal monitors in Washington. None of the numbers I used came from OMB, and none depended on any partisan interpretation. I quoted the debt at the start and end of each term, and I quoted CRFB’s long-term borrowing totals for both presidents. Those figures are public, time-stamped, and applied with identical methodology across administrations.

I’ve said from the start that the dispute here is not about the data; the data are straightforward and publicly verifiable. The disagreement is about the narrative being inferred from the data. I did not claim Trump personally caused every dollar of his increase, and I did not claim Biden personally caused every dollar of his. I stated what the debt levels were during their terms and what the scoring bodies recorded as the long-term effects of the legislation each signed. The empirical record is consistent; the interpretation you are reading into it is not something I wrote.

Maybe this will help:

U.S. Treasury – Official Debt Totals

Historical Debt Outstanding (raw Treasury numbers):

U.S. Treasury – Official Deficit Totals

Monthly Treasury Statement – Deficit data:

CRFB – Trump vs. Biden Debt Comparison (long-term borrowing)

Trump and Biden National Debt comparison:

CRFB – Trump Total Borrowing Analysis

How Much Did President Trump Add to the Debt?

CRFB – Biden Total Borrowing Analysis

How Much Has President Biden Added to the Debt?

CBO – Score of Biden’s Inflation Reduction Act (IRA)

CBO Cost Estimate for H.R. 5376 (Inflation Reduction Act):

JCT – Score of Trump’s 2017 Tax Cuts (TCJA)

Joint Committee on Taxation revenue estimate for Public Law 115-97:

Optional Neutral Confirmation Sources (broader fiscal context)

CBO – Long-Term Budget Outlook
This shows major drivers of federal deficits long-term (healthcare, interest, aging, etc.):

GAO – Fiscal Exposures Report
Government Accountability Office’s official review of structural long-term fiscal pressures:


Again, the math is clear;

The national debt on Jan. 19, 2017, the day before Donald Trump was inaugurated president, was $19,944,429,217,107.

On Jan. 19, 2021, the day before Joe Biden was inaugurated, the debt was: $27,752,835,868,445 — about $7.8 trillion higher.

These are indisputable facts.

I agree that the dispute isn't about the data per se, but about the disparity of methodology used. Why is the Green Raw Deal excluded from the Biden numbers? It is a massive amount of debt that the Biden administration saddled America with - but it's simply ignored in the accounting you rely on. This raid on the public treasury is the signature legislation of Obama's Biden administration, yet excluded from the debt numbers.

Why? The only explanation is partisanship.
 
The Green numbers should not have been excluded.

Bush and the GOP should have not run the Iraq War off the budget but on the credit card.

Both sides are clever as carnies when it comes to wracking up debt. Yes, it is partisanship but both sides.
 
Again, the math is clear;

The national debt on Jan. 19, 2017, the day before Donald Trump was inaugurated president, was $19,944,429,217,107.

On Jan. 19, 2021, the day before Joe Biden was inaugurated, the debt was: $27,752,835,868,445 — about $7.8 trillion higher.

These are indisputable facts.

I agree that the dispute isn't about the data per se, but about the disparity of methodology used. Why is the Green Raw Deal excluded from the Biden numbers? It is a massive amount of debt that the Biden administration saddled America with - but it's simply ignored in the accounting you rely on. This raid on the public treasury is the signature legislation of Obama's Biden administration, yet excluded from the debt numbers.

Why? The only explanation is partisanship.
You keep returning to the claim that the Inflation Reduction Act—what you call “the Green Raw Deal”—was excluded from the Biden numbers. That claim is the core of your objection, so let me address it directly and without rhetoric. The IRA is not excluded from any of the debt analyses I cited. It is fully scored by the Congressional Budget Office, by the Joint Committee on Taxation, and by the Committee for a Responsible Federal Budget. All three bodies placed it in the ten-year scoring baseline just like the Trump tax cuts and just like every major piece of legislation for decades. In fact, CRFB explicitly includes the IRA when calculating Biden’s total long-term borrowing. The reason it does not show up as a large addition to the deficit is because, under official scoring, it reduces the deficit modestly over the ten-year period. That is not my opinion; that is the official CBO score published in the cost estimate. You are welcome to argue that CBO mis-scored the law or that the offsets are unrealistic, but it is simply not factual to say the law was “left out.” It is included and was treated the same way Trump’s tax cuts were treated: scored over the legally required ten-year budget window.

The $6.1 trillion number you keep using does not come from CBO, JCT, CRFB, GAO, Moody’s, S&P, or any other recognized fiscal authority. It comes from political commentary that applies assumptions no professional scorekeeper uses. If CRFB, CBO, or GAO had documented a $6.1 trillion ten-year cost for the IRA, I would cite it. They did not, because that estimate is not part of the official fiscal record. So your claim that I “ignored” trillions is just not aligned with the sources responsible for federal budget scoring.

Your use of raw Treasury numbers for Trump’s first term—$19.94T to $27.75T—is correct. I never disputed that. Raw debt rises are factual, but they do not capture the long-term effect of legislation, which is why CRFB reports both the immediate rise and the ten-year impact. That is why Trump’s raw increase is about $7.8T, while CRFB’s long-term borrowing number is about $8.4T. That difference does not reflect partisanship; it reflects two different measurements. The same distinction applies to Biden. Treasury numbers show the raw rise from $28.45T to $35.46T. CRFB numbers show the long-term effect of the legislation he signed. Both figures are correct because they measure different things.

Nothing I posted relies on OMB. Nothing came from White House messaging. Everything came from U.S. Treasury for raw debt totals and CRFB, CBO, and JCT for long-term legislative scoring. These are the same institutions Congress has used for decades to measure the fiscal effects of major laws. They apply the same rules whether the president is Republican or Democrat. There is no partisan exemption for Trump or special forgiveness for Biden.

The idea that the only explanation is “partisanship” requires you to assume a conspiracy involving Treasury, CBO, JCT, CRFB, GAO, and every independent budget analyst. That is a very large leap when all of them publish their methodologies openly and score every administration using the same statutory rules. The simpler, evidence-based explanation is the correct one: the IRA was scored and included; it did not add what you think it added; and the official fiscal monitors recorded Biden’s total long-term borrowing at about $4.7T using the same method they used to score Trump at about $8.4T.

The facts are not partisan. They are simply the record.
 
The Green numbers should not have been excluded.

Bush and the GOP should have not run the Iraq War off the budget but on the credit card.

Both sides are clever as carnies when it comes to wracking up debt. Yes, it is partisanship but both sides.
You’re right that both parties have contributed to the long-term debt, and neither side has a clean record when it comes to fiscal discipline. The Iraq War being financed through off-budget emergency appropriations is a valid example on the Republican side, and Democrats have had their own moments of creative budgeting. But the specific question here isn’t about whether both parties have used questionable methods over the years—it’s whether the Inflation Reduction Act was excluded from the official debt calculations. It wasn’t. CBO, JCT, and CRFB all scored it and incorporated it into their long-term projections. Whether one thinks the law was good or bad, or whether either party handles debt responsibly, the IRA was not left out of the data. The broader history of bipartisan fiscal maneuvering is real, but it doesn’t change the factual record about how this particular law was scored.
 
You keep returning to the claim that the Inflation Reduction Act—what you call “the Green Raw Deal”—was excluded from the Biden numbers. That claim is the core of your objection, so let me address it directly and without rhetoric. The IRA is not excluded from any of the debt analyses I cited. It is fully scored by the Congressional Budget Office, by the Joint Committee on Taxation, and by the Committee for a Responsible Federal Budget. All three bodies placed it in the ten-year scoring baseline just like the Trump tax cuts and just like every major piece of legislation for decades. In fact, CRFB explicitly includes the IRA when calculating Biden’s total long-term borrowing. The reason it does not show up as a large addition to the deficit is because, under official scoring, it reduces the deficit modestly over the ten-year period. That is not my opinion; that is the official CBO score published in the cost estimate. You are welcome to argue that CBO mis-scored the law or that the offsets are unrealistic, but it is simply not factual to say the law was “left out.” It is included and was treated the same way Trump’s tax cuts were treated: scored over the legally required ten-year budget window.

The $6.1 trillion number you keep using does not come from CBO, JCT, CRFB, GAO, Moody’s, S&P, or any other recognized fiscal authority. It comes from political commentary that applies assumptions no professional scorekeeper uses. If CRFB, CBO, or GAO had documented a $6.1 trillion ten-year cost for the IRA, I would cite it. They did not, because that estimate is not part of the official fiscal record. So your claim that I “ignored” trillions is just not aligned with the sources responsible for federal budget scoring.

Your use of raw Treasury numbers for Trump’s first term—$19.94T to $27.75T—is correct. I never disputed that. Raw debt rises are factual, but they do not capture the long-term effect of legislation, which is why CRFB reports both the immediate rise and the ten-year impact. That is why Trump’s raw increase is about $7.8T, while CRFB’s long-term borrowing number is about $8.4T. That difference does not reflect partisanship; it reflects two different measurements. The same distinction applies to Biden. Treasury numbers show the raw rise from $28.45T to $35.46T. CRFB numbers show the long-term effect of the legislation he signed. Both figures are correct because they measure different things.

Nothing I posted relies on OMB. Nothing came from White House messaging. Everything came from U.S. Treasury for raw debt totals and CRFB, CBO, and JCT for long-term legislative scoring. These are the same institutions Congress has used for decades to measure the fiscal effects of major laws. They apply the same rules whether the president is Republican or Democrat. There is no partisan exemption for Trump or special forgiveness for Biden.

The idea that the only explanation is “partisanship” requires you to assume a conspiracy involving Treasury, CBO, JCT, CRFB, GAO, and every independent budget analyst. That is a very large leap when all of them publish their methodologies openly and score every administration using the same statutory rules. The simpler, evidence-based explanation is the correct one: the IRA was scored and included; it did not add what you think it added; and the official fiscal monitors recorded Biden’s total long-term borrowing at about $4.7T using the same method they used to score Trump at about $8.4T.

The facts are not partisan. They are simply the record.


I cited my claim;

To make it very easy;

1764627479749.png
 
I cited my claim;

To make it very easy;

View attachment 66762
I see the table you posted, and it’s simply a summary of the raw debt increase during Biden’s term. That number—about $6.17 trillion from early 2021 to early 2024—comes straight from Treasury’s Historical Debt Outstanding dataset, which I have already acknowledged and used myself. There is no disagreement about the raw increase; it is exactly what the Treasury record shows. But that table does not address the question I’ve been discussing with you, which is the difference between raw debt added during a presidency and the long-term borrowing impact of legislation signed during a presidency. Those are two different measurements. Raw Treasury totals describe how much the national debt changed while someone was in office. CRFB’s long-term scoring describes how much new borrowing their laws added over the ten-year budget window. Posting the ConsumerAffairs graphic doesn’t contradict anything I said; it’s simply repeating a number I already acknowledged. It answers the “how much did the debt rise?” question, not the “how much debt did each president’s legislation create?” question. Those two metrics coexist, and both are valid—but they describe different things.
 
Trump will be over 11 trillion by the end of next year.
1acupcake-copy-1.gif
 
And Trump has committed to more than that now during his terms, yes?
If you’re asking whether Trump, across his first term plus his current term, has now committed to more long-term borrowing than Biden, the answer is yes. CRFB’s official scoring places Trump’s first-term legislative impact at about $8.4 trillion in new ten-year borrowing. Biden’s full term comes in at roughly $4.7 trillion using the same method. And in Trump’s current term, the appropriations increases and early legislative actions are already adding several trillion more on top of his earlier total. So if we’re talking about cumulative long-term borrowing commitments, Trump’s number is now higher.

It is also important to note that a substantial portion of the 2025 fiscal impact under Trump is not yet fully visible in the published long-term scoring, because many of the supplemental appropriations, emergency authorities, and executive-branch spending directives take time to be reflected in CBO and CRFB analyses. That does not mean the spending is hidden; it means the formal scoring process lags behind the legal changes. As those scores are released, they will be incorporated the same way CRFB incorporates the fiscal effects of every administration’s actions.

The point remains the same: using the standard methodology applied to every president, Trump’s cumulative borrowing commitments now exceed Biden’s.
 
Back
Top