
You are using an out of date browser. It may not display this or other websites correctly.
You should upgrade or use an alternative browser.
You should upgrade or use an alternative browser.
Questions liberals can't seem to answer
- Thread starter Legion
- Start date
Why are the 9 most segregated cities in the US all run by DEMOCRATS?
9.Kansas City, MO
Mayor Sly James (D)
> Pct. of population living in segregated areas: 37.8%
> Black poverty rate: 26.4%
> White poverty rate: 8.3%
> Black unemployment rate: 13.4%
> White unemployment rate: 5.6%
Roughly 765,000 Kansas City residents — or 37.8% of the city’s population — live in a homogeneous zip code, or where at least 80% of residents share the same skin color or ethnicity, the ninth highest proportion in the country. Out of the 166 zip codes that make up the Kansas City metro area, 123 are home to predominantly white residents. White city residents have very little interaction with the city’s black residents. Of all the people a white person comes into contact with in the area, only 5.5% are black, significantly less frequent than the similar figure of 12.8% of contacts across the 50 largest metro areas. Segregation like this can have very discernible consequences. White households earn nearly twice the median income of black households. Three of the area’s zip codes are home to 15.9% of the metro’s black population, and the median household income in each is less than $30,000 annually. More than 26% of the metro area’s black population lives in poverty, slightly less than the national poverty rate among black Americans but more than three times as high as the poverty rate among the city’s white residents of 8.3%. School systems are also affected by segregation. While one-third of all metro area residents have at least a bachelor’s degree, in zip codes that are home to predominantly black residents, less than 12% of adults have a college degree.
8. Birmingham, AL
Mayor Randall Woodfin (D)
> Pct. of population living in segregated areas: 39.8%
> Black poverty rate: 26.9%
> White poverty rate: 10.4%
> Black unemployment rate: 8.3%
> White unemployment rate: 5.7%
Birmingham was perhaps the most extreme example of segregation in the 1960s, but it has come a long way from its days of racially segregated restrooms and lunch counters. Nevertheless, the metro area is still among the most segregated areas in the country, with roughly 40% of its population living in areas with nearly uniform racial composition. While more than half of the zip codes in Birmingham are all but racially homogeneous, black and white area residents may be even more segregated within these neighborhoods. On average, 70% of people a white person interacts with are also white, while 60% of people a black person comes in contact with are also black. Nationally, more than 13% of black Americans are unemployed, but in Birmingham 8.3% are. While this is one of the lowest jobless rates among black workers in the country, it is still higher than the unemployment rate of 5.7% among white residents. Despite the strong labor market, there is still a wide disparity in income. Black households had a median income of $33,203, while median income for white households was more than $56,000.
7. Boston-Cambridge-Newton, MA-NH
Boston Mayor Marty Walsh (D)
Cambridge Mayor Marc C. McGovern (D)
Newton Mayor Ruthanne Fuller (D)
> Pct. of population living in segregated areas: 40.4%
> Black poverty rate: 21.5%
> White poverty rate: 6.8%
> Black unemployment rate: 9.2%
> White unemployment rate: 5.9%
Racial and socioeconomic segregation are often one and the same. As is the case across the nation, black and Hispanic families in the Boston area tend to live in higher poverty neighborhoods and earn lower incomes than their white peers. The median household incomes in all but one of the 145 predominantly white zip codes in the Boston area exceed the national median household income of $53,046. White households earn $79,730 annually, while a typical Hispanic household earns less than half that income, at $39,810 annually — the largest gap between whites and Hispanics among metros reviewed. The two non-white zip codes — both located in the Lawrence area — are home to less than 1% of area residents, but nearly 10% of all Hispanics and Latinos living in the area. A typical household living in each of these zip codes earns $18,261 and $31,214, respectively. Similarly, while 6.8% of white metro area residents live in poverty, 26.1% of Hispanic residents do. A growing body of research suggests that residential racial segregation promotes poverty, which in turn results in worse educational outcomes. These two zip codes also have far lower educational attainment rates than national rates, an even bigger disparity compared to white residents’ education levels.
6. Nashville, TN
Nashville Mayor David Riley (D)
> Pct. of population living in segregated areas: 45.0%
> Black poverty rate: 25.2%
> White poverty rate: 10.5%
> Black unemployment rate: 11.1%
> White unemployment rate: 4.7%
The gap between white and black median household incomes in the Nashville area is $21,034, making Nashville one of only three metro areas reviewed with a lower gap than the national one. However, while the white unemployment rate of 4.7% was well below the national jobless rate, 11.1% of black area workers were unemployed. And while just over one in 10 white residents lived in poverty, more than one in four black residents did. Also, like in nearly every other U.S. metro area, the poorest zip code in the Nashville area is predominantly black. The 37208 zip code is located near downtown Nashville, while the predominantly white neighborhoods are largely located outside the city proper. As is the case in most of the country, residential segregation in the Nashville area is largely due to federal home-financing policies in the 1950s that were unavailable to black residents. As Rothstein explained, the intentional segregation of these neighborhoods also contributed to income and wealth disparities.
5. Cincinnati, OH
Mayor David Riley (D)
> Pct. of population living in segregated areas: 48.6%
> Black poverty rate: 33.5%
> White poverty rate: 10.3%
> Black unemployment rate: 10.2%
> White unemployment rate: 6.1%
The racial divide in Cincinnati is one of the greatest in the country. While 10.3% of white area residents live in poverty, more than 30% of Hispanic residents and more than 33% of black residents live below the poverty line, both among the highest rates in the country. Home ownership rates among black Americans in Cincinnati are similarly low, as just 34.1% of black households are owned by the people living in them. Among whites, the rate is nearly 74%. According to 24/7 Wall St.’s analysis, more than 48% of Cincinnati residents live in zip codes where the vast majority of residents have the same skin color or ethnicity, the fifth highest rate in the country. However, this does not fully capture segregation in the area. Some racial groups also tend to cluster with each other, often along income lines. Asians and whites tend to cluster together, just as blacks and Hispanics also tend to live in the same neighborhoods. In the Cincinnati area, 74.1% of residents lived in a zip code where one of these two combined groups made up at least 80% of the population. This higher level of segregation among the combined groups was most pronounced among whites and Asians — 90% of the combined group lived with each other.
4. Louisville, KY
Mayor Greg Fischer (D)
> Pct. of population living in segregated areas: 51.1%
> Black poverty rate: 31.1%
> White poverty rate: 11.0%
> Black unemployment rate: 13.2%
> White unemployment rate: 6.4%
The Louisville metro area may be in a unique position to reverse the impacts of segregation in the future. The majority of the area is located in Jefferson County, which is represented by a single school district. Since the 1970s, Louisville’s busing plan helped diversify the student body in many schools. While schools may be more diverse, residents still live in sharply divided neighborhoods. Two zip codes in the center of the city are home to 2.7% of the area’s population, but nearly 20% of the city’s black population live there. And 61.7% of the area’s white residents live in homogeneous zip codes. Residential segregation can have an enormous impact on social and economic factors. In both of the primarily black zip codes in Louisville, less than 10% of adult residents have at least a bachelor’s degree, well below the 26.3% of all metro area adults with such a degree. Additionally, the median income of black households of just $30,000 is well below the median income of white households of more than $54,000.
3. Milwaukee, WI
Mayor Tom Barrett (D)
> Pct. of population living in segregated areas: 51.4%
> Black poverty rate: 38.4%
> White poverty rate: 7.6%
> Black unemployment rate: 16.3%
> White unemployment rate: 5.9%
While Milwaukee did not at first attract black Americans from the South during the Great Migration, many began moving to the city in the 1960s just as manufacturing jobs began disappearing. According to the New Republic, “This left almost no time for the city to develop a black middle class or a leadership elite.” Perhaps as a result, more than half of the city’s population lives in a zip code where at least 80% of residents share the same skin color. Of the area’s roughly 80 zip codes, three are home to nearly 25% of the city’s black population. The median household income in two of these zip codes is just $22,000. By contrast, a typical white household earns $62,697. Milwaukee’s segregation issues go well beyond housing patterns. On average, three-quarters of all people that a white person sees on the street in the Milwaukee metro area are white, and 60% of people a black person sees are black, both indicating among the highest levels of isolation from other racial groups of metro areas reviewed.
2. Detroit, MI
Mayor Mike Dugan (D)
> Pct. of population living in segregated areas: 51.9%
> Black poverty rate: 33.3%
> White poverty rate: 10.6%
> Black unemployment rate: 15.1%
> White unemployment rate: 7.6%
With 51.9% of Detroit residents living in zip codes where the vast majority of residents share the same skin color or ethnicity, the area is the second most segregated metropolitan area in the country. This figure alone does not convey the severity of segregation in Detroit. In 18 of the area’s zip codes, more than 80% of residents are black, and those zip codes are home to more than half of the area’s black population. Additionally, the 106 zip codes dominated by white residents are home to nearly 60% of the metro area’s white population. Poor socioeconomic measures are often associated with severe segregation. A typical black household earns just $30,935 annually, more than $4,000 lower than the comparable national figure and nearly $30,000 below white households median income of $59,307. And while Detroit’s unemployment rate has come a long way from its high of 17.2% in June 2009, more than 15% of black residents were unemployed in 2013, double the white unemployment rate of 7.6%.
1. Cleveland, OH
Mayor Frank G. Jackson (D)
> Pct. of population living in segregated areas: 55.1%
> Black poverty rate: 33.6%
> White poverty rate: 9.3%
> Black unemployment rate: 20.2%
> White unemployment rate: 5.4%
With more than 55% of its population living in homogeneous zip codes, the Cleveland metro area is the most segregated urban area in the country. Of the roughly 100 zip codes in the area, 63 are predominantly white and are home to nearly 70% of Cleveland’s white population. The metro area’s black population is similarly segregated, with 30.9% concentrated in just six zip codes. Segregation by income is also a problem in Cleveland. In February, the Martin Prosperity Institute at the University of Toronto ranked the Cleveland metro area number one in income segregation among large metro areas. Median household income in just one of the primarily black zip codes in the area is greater than $24,000. By contrast, median income among white households in the area is nearly $57,000. Low incomes may be the result of a sluggish labor market. In 2013, 20.2% of black Cleveland residents were unemployed, the highest rate among large metro areas and nearly four times the white unemployment rate of 5.4%.
https://tinyurl.com/yxhf5lym
Why do liberals ignore the shameful treatment of Black people by Muslims?
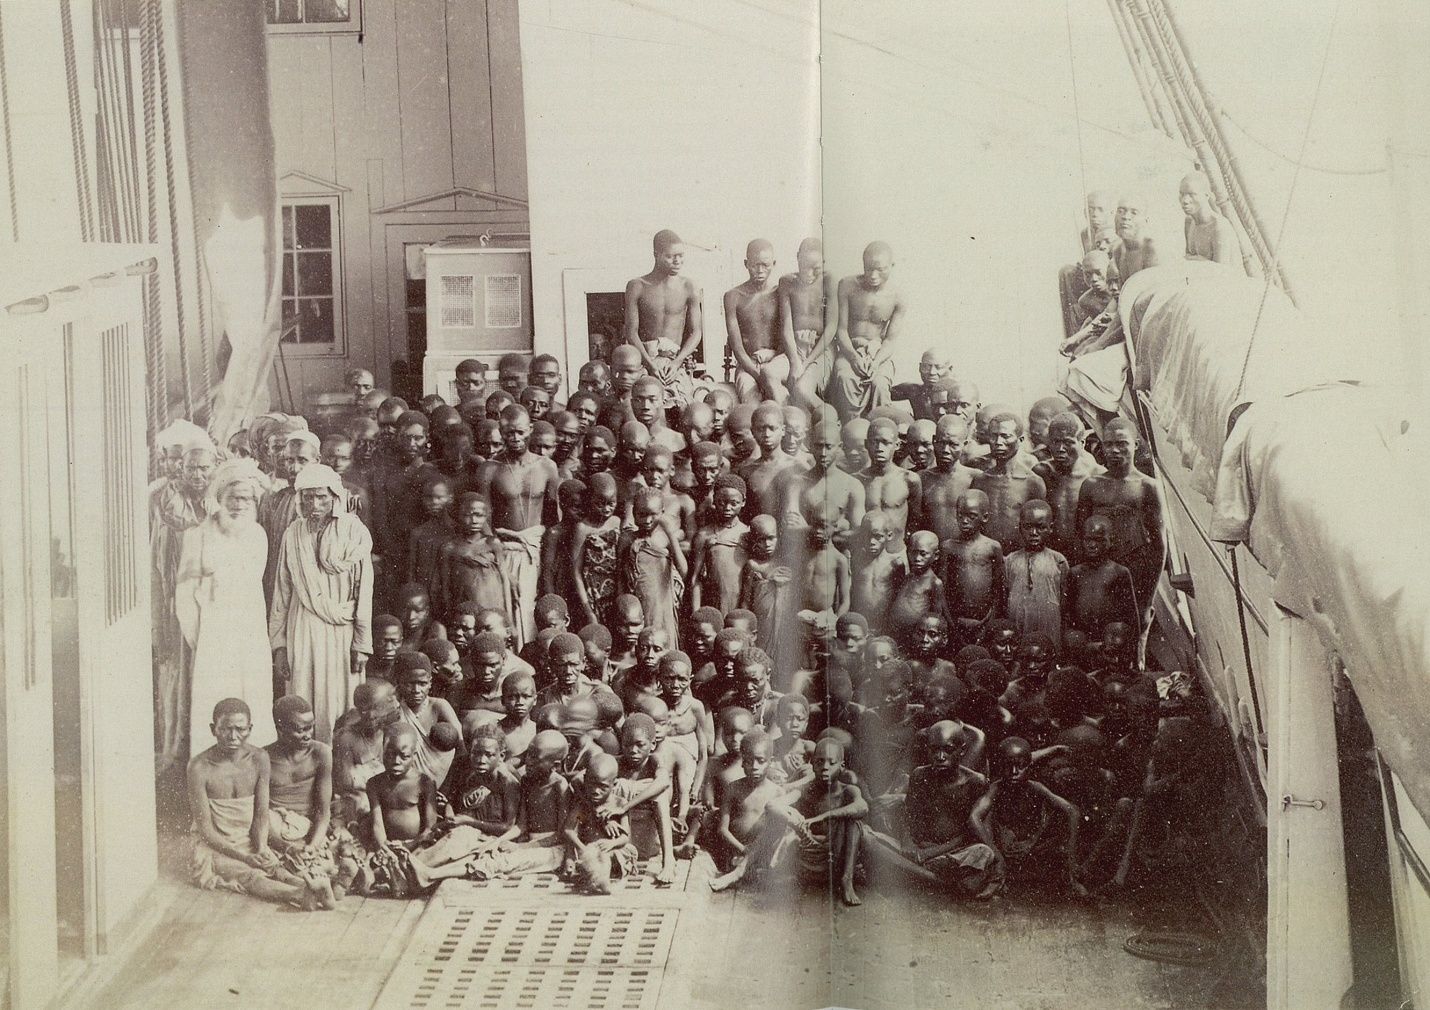
ABUSE OF BLACK PEOPLE BY MUSLIMS GOES BACK CENTURIES & IS STILL HAPPENING
Slavery in the Muslim world first developed out of the slavery practices of pre-Islamic Arabia, and was at times radically different, depending on social-political factors such as the Arab slave trade.
Throughout Islamic history, slaves served in various social and economic roles, from powerful emirs to harshly treated manual laborers. Early on in Muslim history they were used in plantation labor similar to that in the Americas, but this was abandoned after harsh treatment led to destructive slave revolts, the most notable being the Zanj Rebellion of 869–883.
Slaves were widely employed in irrigation, mining, and animal husbandry, but the most common uses were as soldiers, guards, and domestic workers.
Among black slaves, there were roughly two females to every one male. Two rough estimates by scholars of the number of slaves held over twelve centuries in the Muslim world are 11.5 million and 14 million, while other estimates indicate a number between 12 to 15 million slaves prior to the 20th century.
Many slaves were often imported from outside the Muslim world. The Arab slave trade was most active in West Asia, North Africa, and Southeast Africa. In the early 20th century (post-World War I), slavery was gradually outlawed and suppressed in Muslim lands, largely due to pressure exerted by Western nations such as Britain and France.
Slavery in the Ottoman Empire was abolished in 1924 when the new Turkish Constitution disbanded the Imperial Harem and made the last concubines and eunuchs free citizens of the newly proclaimed republic.
Slavery in Iran was abolished in 1929. Among the last states to abolish slavery were Saudi Arabia and Yemen, which abolished slavery in 1962 under pressure from Britain; Oman in 1970; and Mauritania in 1905, 1981, and again in August 2007.
However, slavery claiming the sanction of Islam is documented at present in the predominantly Islamic countries of the Sahel, and is also practiced in territories controlled by Islamist groups, as in Libya.
http://tinyurl.com/yxc8njro
canceled.2021.1
#AMERICAISDEAD
Muslimes appear to be a favored class among JPP leftists
Bourdeaux Nights
Verified User
Muslimes appear to be a favored class among JPP leftists
Anyone you sick fucks want to dehumanize, that haven't done anything, we give our protection. I've become convinced that you guys would rather have someone to blame, then have a solution. Especially when those solutions equate some hard truths.
canceled.2021.1
#AMERICAISDEAD
Anyone you sick fucks want to dehumanize, that haven't done anything, we give our protection. I've become convinced that you guys would rather have someone to blame, then have a solution. Especially when those solutions equate some hard truths.
There is a solution to the muslime problem
Muslimes appear to be a favored class among JPP leftists
They do. Apparently the left feels they can do no wrong.
Anyone you sick fucks want to dehumanize, that haven't done anything, we give our protection. I've become convinced that you guys would rather have someone to blame, then have a solution. Especially when those solutions equate some hard truths.
Muslims cruelly oppressed and enslaved Black men, women and children for over 1,000 years. Some are still doing it. Why?
There is a solution to the muslime problem
A first step would be to apply the same standards to Muslims that liberals apply to others. They won't, it seems.