Climate Change - The Roman Warm Period, MWP & LIA were global events proven by proxy data

"The Little Ice Age in South Africa, from around AD 1300 to 1800, and medieval warming, from before 1000 to around 1300, are shown to be distinctive features of the regional climate of the last millennium. The proxy climate record has been constituted from oxygen and carbon isotope and colour density data obtained from a well-dated stalagmite derived from Cold Air Cave in the Makapansgat Valley. The climate of the interior of South Africa was around 1°C cooler in the Little Ice Age and may have been over 3°C higher than at present during the extremes of the medieval warm period."

https://www.researchgate.net/public..._Ice_Age_and_medieval_warming_in_South_Africa

Roman Warm Period

"This record comparison consistently shows the Roman as the warmest period of the last 2 kyr, about 2 °C warmer than average values for the late centuries for the Sicily and Western Mediterranean regions."

https://www.nature.com/articles/s41598-020-67281-2

Roman Warm Period was global

"After the 1st century ce there is evidence of a progressive rise in sea level. Roman buildings and peat layers were covered by the marine transgression in the Netherlands, southern England, and parts of the Mediterranean. At the same time, drying and warming trends were associated with alluviation of streams and general desiccation in southern Europe and North Africa. Similar alluviation occurred in the American Southwest. This warming and desiccation trend is evident also in the subtropics of the Southern Hemisphere. "

https://www.britannica.com/science/Holocene-Epoch/Classical-Roman-Period

We've had weather satellites for only 50 years. 2K years ago, they would have shown these were global events, even more extreme than the proxy record shows.
 
It seems you don't want to do any research but only want to claim you can't see what you haven't even bothered to search for.


Kafir posted the isotope chart showing the ratio change is so tiny it is barely outside the margin of error.
 
So you agree it was global, and you blame the Sun.

And why won't you compare proxy tree ring data to modern tree ring data instead of satellites. At least that wouldn't violate the rules of science.
ROFLMAO. It seems you don't understand the science or how they are able to use tree ring data because they compare modern tree rings to ancient tree rings to calculate temperature.
Why don't you compare your head up your ass to your head up your ass. At leas that wouldn't violate your "science."
 
ROFLMAO. It seems you don't understand the science or how they are able to use tree ring data because they compare modern tree rings to ancient tree rings to calculate temperature.
Why don't you compare your head up your ass to your head up your ass. At leas that wouldn't violate your "science."
Prove it by posting the comparison study HERE for all to see.
 
Outside the margin of error is outside the margin of error. Why do you deny science when it is science?
Clearly, like Kafir you do not understand the chart. The change IS NOT significant.

You and he don't even know what the margins of errors are. You both are talking out your ass to hide your ignorance.
 
Prove it by posting the comparison study HERE for all to see.
OMFG. There are so many studies that do that, I can't possibly post them all. Here are 5 to start you out.

 
Clearly, like Kafir you do not understand the chart. The change IS NOT significant.

You and he don't even know what the margins of errors are. You both are talking out your ass to hide your ignorance.
Since you know the margin of error, tell us. (This ought to be good.)

A result that is outside the margin of error is statistically significant since it is unlikely to be caused by errors in the data. You claimed the result was outside the margin of error so you must know the margin. Then since you have admitted that it was outside the margin of error, it must be statistically significant.
What? YOU don't even know the margin of error? ... and you're trying to discuss the science with me. :palm:
 
Last edited:
OMFG. There are so many studies that do that, I can't possibly post them all. Here are 5 to start you out.

So you post a chart from the 1400's :palm:

Now for the truth MSNBC hides from you ...

"
AI Overview


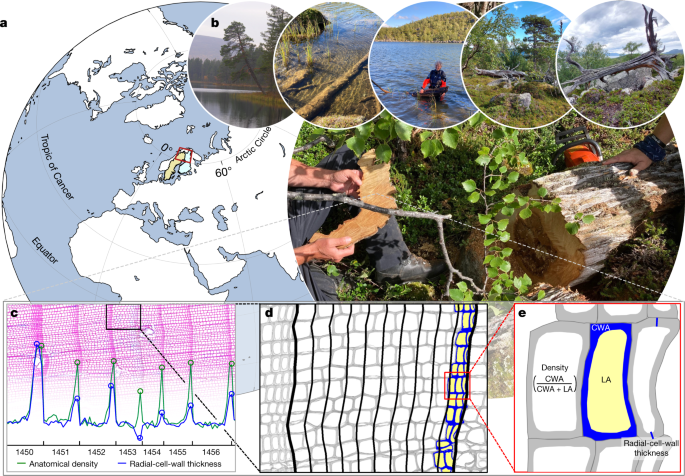
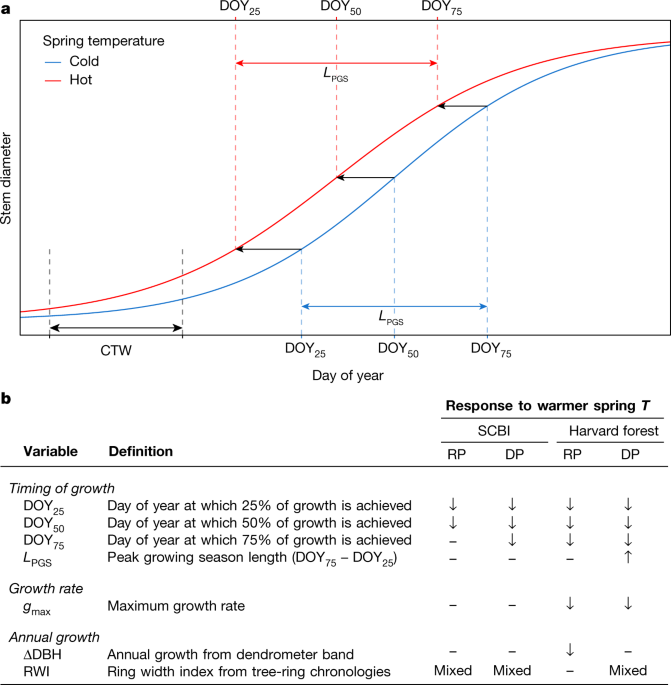
The divergence problem is a phenomenon in dendroclimatology, the study of past climates using tree rings, where the temperatures reconstructed from tree rings do not match the instrumental temperatures measured by thermometers. This discrepancy has been observed in tree-ring width and density records from many northern latitude sites since the mid-20th century.


The divergence problem is characterized by:
  • Warmer instrumental temperatures
    Thermometer records show a substantial warming trend in the late 20th century.
  • Underestimated temperatures in tree-ring reconstructions
    However, many tree rings from these sites do not show a corresponding change in their maximum latewood density. "
 
Since you know the margin of error, tell us. (This ought to be good.)

A result that is outside the margin of error is statistically significant since it is unlikely to be caused by errors in the data. You claimed the result was outside the margin of error so you must know the margin. Then since you have admitted that it was outside the margin of error, it must be statistically significant.
Did you figure it out, yet? Shouldn't Kafir's chart show the margin of error?
 
Outside the margin of error is outside the margin of error. Why do you deny science when it is science?
Because it is so tiny, it is insignificant. Why do you and Kafir NOT know the critically important margin of error? :dunno:

It actually could be within the margin of error depending on where the samples were tested and measured. You should already know this information. :palm:
 
Last edited:
Because it is so tiny, it is insignificant. Why do you and Kafir NOT know the critically important margin of error? :dunno:

It actually could be within the margin of error depending on where the samples were tested and measured. You should already know this information. :palm:
Outside the margin of error is outside the margin of error. (In statistics outside the margin of error makes it significant which is a math term which you seem to not understand.)

It could actually be farther outside the margin of error depending on where the samples were tested and measured. You should already know this information. You cant assume different samples would result in different results if you are actually doing science. You would actually get different samples and test them.
I am talking about different testing facilities, different labs. It is NOT an issue of different samples.

The chart fails to show the margin of error. It breaks the rules of science.
 
I am talking about different testing facilities, different labs. It is NOT an issue of different samples.

The chart fails to show the margin of error. It breaks the rules of science.
Can you point me to the rule of science that says a chart must include a margin of error?

You don't seem to actually know much about how science is published if you think it is only a chart.
 
Can you point me to the rule of science that says a chart must include a margin of error?

You don't seem to actually know much about how science is published if you think it is only a chart.
Honesty and openness are scientific principles. You should know htis.

It is You who thinks it is only a chart, not me. It is scientific measurements. Why is the margin of error kept secret?
 
Last edited:
Botanist David Bellamy was fired by the BBC after he dismissed "man-made global warming" as "poppycock".

Interviewer: "Do you believe man-made climate change is happening?"

Bellamy: "Absolutely not. There is no actual proof. There are a whole series of computer models, and you can fiddle computer models to say what you like. There is no proof at all scientifically, there are just models."


Honesty and openness are scientific principles. You should know htis.

It is You who thinks it is only a chart, not me. It is scientific measurements. Why is the margin of error kept secret?
Into the Night should be along at any time to tell that there is no such thing as scientific measurements.

Why do you think the margin of error was secret? Did you read the published science? Or did you just look at the chart and ignore the rest?
 
Honesty and openness are scientific principles. You should know htis.

It is You who thinks it is only a chart, not me. It is scientific measurements. Why is the margin of error kept secret?
What is the margin of error? You still haven't told us. I have asked you a couple of times.

If you don't know what the margin of error is then how can you claim that the results are barely outside the margin of error? Since you can't tell us the margin of error, we know that you can't tell us if the results are close to a margin of error.
 
Back
Top